28 March 2013

SAS Dashboard : Linking indicators with interactions

To create a dashboard that opens a report which links to another indicator , when the business user clicks the indicator , a new window shows the other indicator with the interactions with the current indicator.

* Using: Information Map as the indicator data , including the filters which prompting the users to choose the data from a static list
* You have to choose a default value for this static list in order to be appeared in creating the dashboard indicators .

say we have two indicators : indicator1 , indicator2
- indicator1 :include a chart with a "Date" variable and from which we want to setup the link
- indicator2 : is the target which filters upon a chosen date from indicator1
 ** indicator2 's data must contains the filter we made previously in the information map

Steps:
1- From indicator1 ,Select the "link" icon

2- Choose the link type: Indicator


3- Browse the files and select indicator2
* For making the interactions between the two indicators , both the two indicators must have the same information map as their data
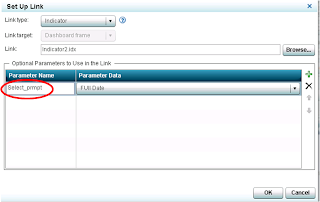
4- Now,  set the parameters for interactions by clicking the + icon:


5- Select the parameter data which is attribute we make a filter on ,say  Date
6- Write the parameter name which is exactly the same name of the prompt we created in the filter "case sensitive"

Now view the operation of the linking , from indicator1 click the view icon
Output :
Click on any value from the chart to view the detailed table of the selected date , say selecting the value "2/17/2013"
the result is a detailed filtered table which we made previously at indicator2 .


No comments:

Post a Comment

Feel free to write any comments or ideas!

SAS Dashboard : Linking indicators with interactions

To create a dashboard that opens a report which links to another indicator , when the business user clicks the indicator , a new window shows the other indicator with the interactions with the current indicator.

* Using: Information Map as the indicator data , including the filters which prompting the users to choose the data from a static list
* You have to choose a default value for this static list in order to be appeared in creating the dashboard indicators .

say we have two indicators : indicator1 , indicator2
- indicator1 :include a chart with a "Date" variable and from which we want to setup the link
- indicator2 : is the target which filters upon a chosen date from indicator1
 ** indicator2 's data must contains the filter we made previously in the information map

Steps:
1- From indicator1 ,Select the "link" icon


2- Choose the link type: Indicator


3- Browse the files and select indicator2
* For making the interactions between the two indicators , both the two indicators must have the same information map as their data
4- Now,  set the parameters for interactions by clicking the + icon:


5- Select the parameter data which is attribute we make a filter on ,say  Date
6- Write the parameter name which is exactly the same name of the prompt we created in the filter "case sensitive"

Now view the operation of the linking , from indicator1 click the view icon
Output :
Click on any value from the chart to view the detailed table of the selected date , say selecting the value "2/17/2013"
the result is a detailed filtered table which we made previously at indicator2 .

0 Comments:

Post a Comment

Feel free to write any comments or ideas!